TheBrief · Learn With Me
The Electric Grid: America's Biggest Technological Bottleneck
The 60 Second Read
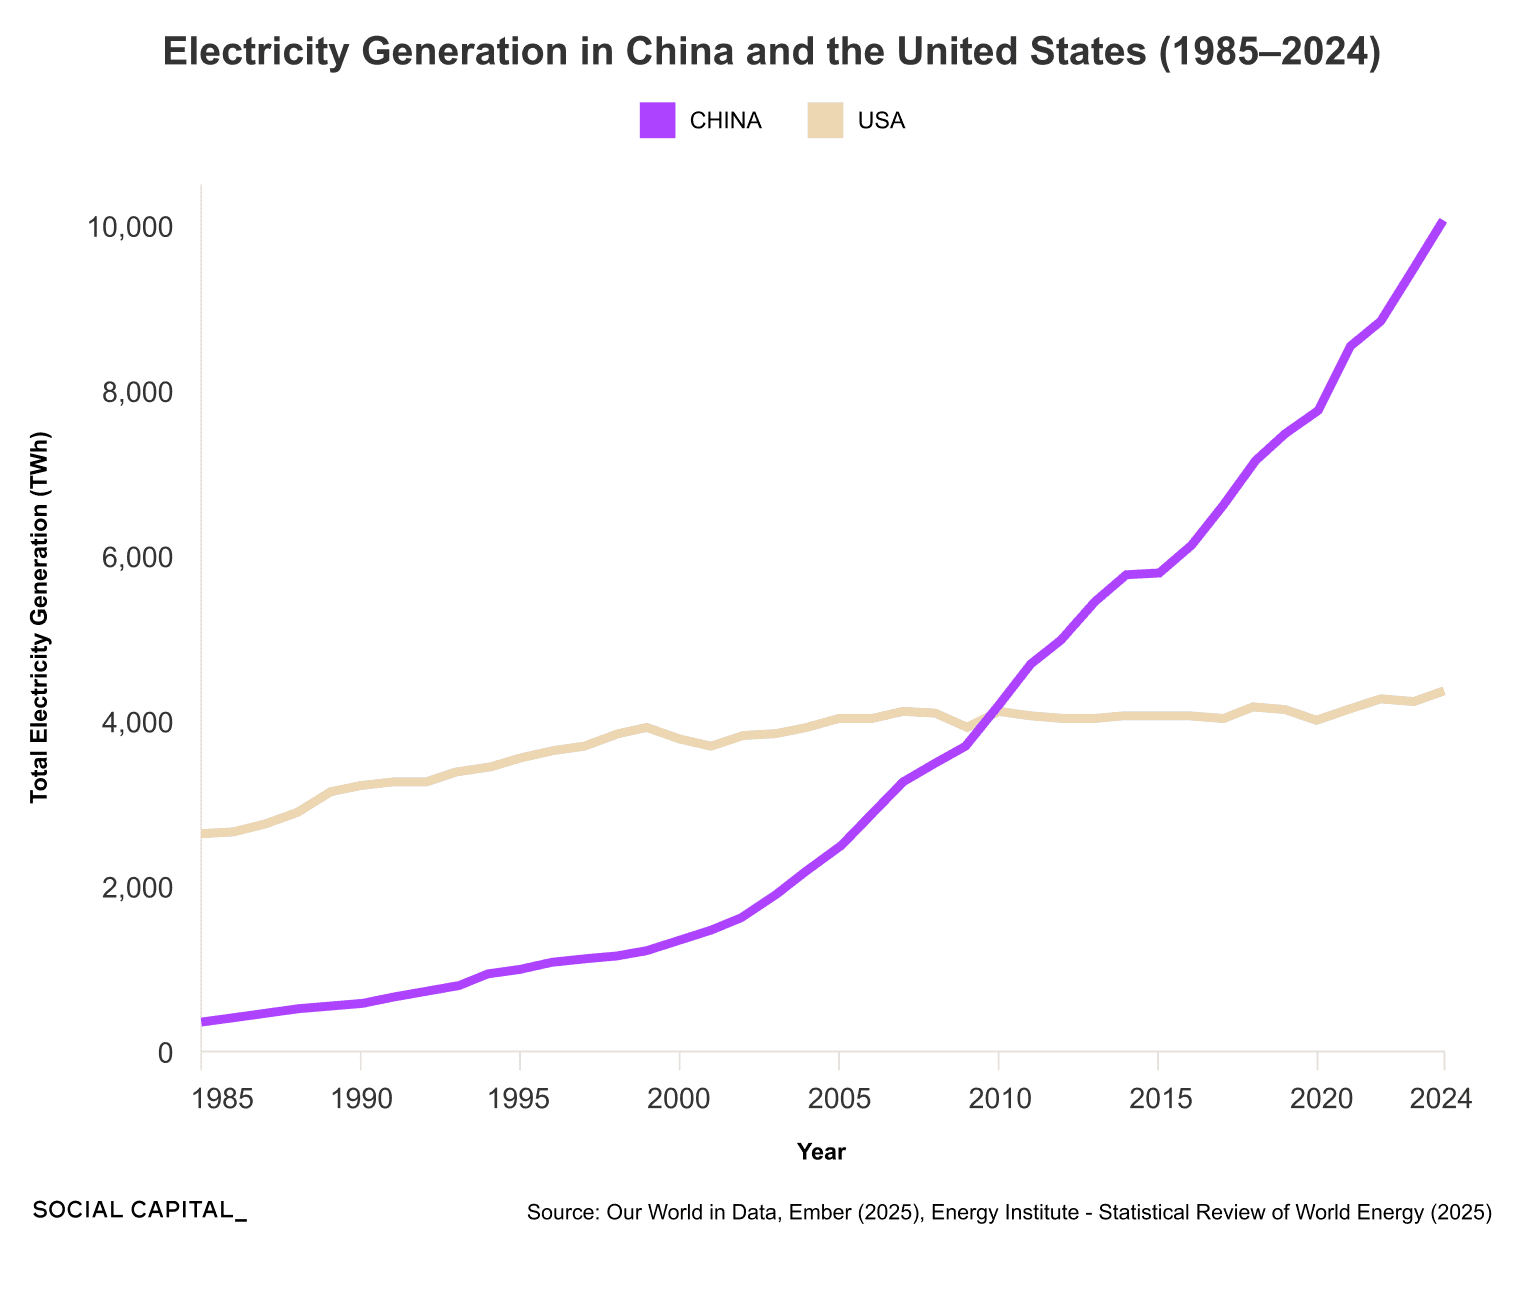
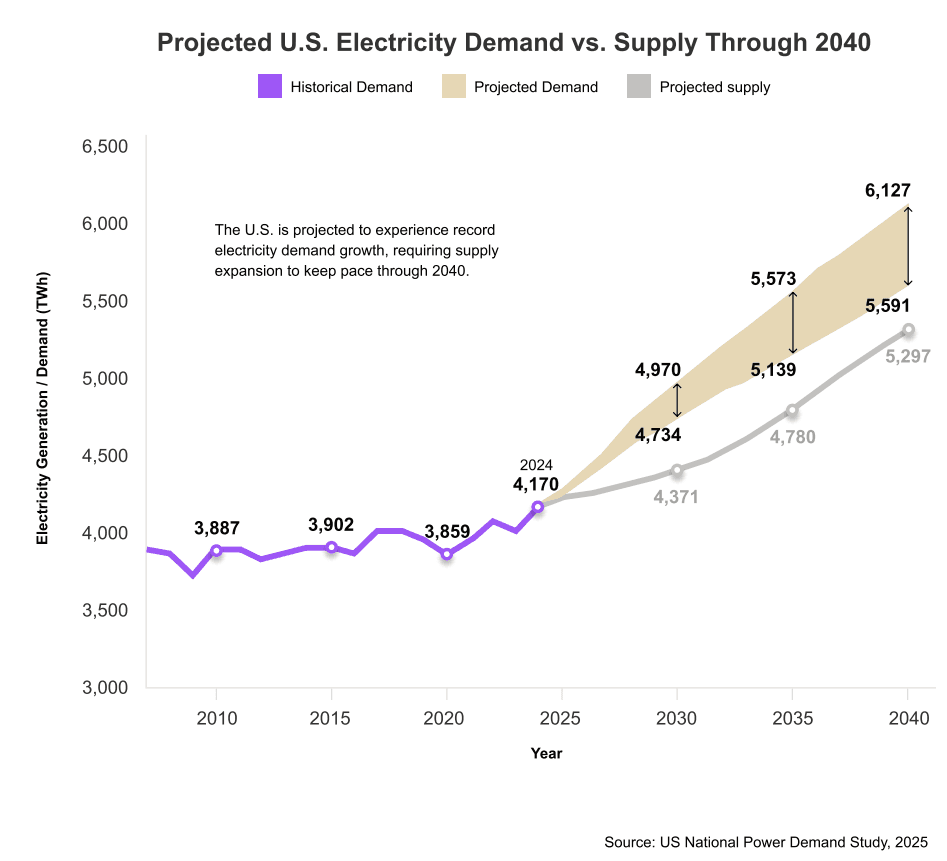
In February 2021, a single winter storm took down the Texas grid, caused 246 deaths, and inflicted over $100B in economic loss. The machine that failed is the largest in the world: more than 6 million miles of power lines carrying roughly 1.3 terawatts to more than 340 million Americans, much of it built in the 1960s and 1970s. This Deep Dive explains how that machine works, why it stopped growing, and why it has become America's biggest technological bottleneck. The numbers frame the problem. For a century, US grid capacity grew roughly tenfold every 30 years; in the last 25 years it grew only 30%. China's generation has grown over 600% since 2000 and in 2024 exceeded the US, EU, and India combined. Now demand is surging for the first time in decades: the US added roughly 285 TWh over the past 15 years and needs roughly 2,000 more over the next 15, triple the forecast from just two years ago, while the Department of Energy projects the risk of outages rising 100x by 2030. The AI race is fundamentally an energy race, and the grid is the track America is running it on.
Key Takeaways
- Takeaway 01
America stopped adding power
For a century, US grid capacity grew roughly tenfold every 30 years, from about 1 GW in the 1900s to about 1 TW by the 2000s. In the last 25 years it grew only 30%, with generation stagnant around 4,000 to 4,200 TWh since 2000. Efficiency gains masked the lack of net growth.
- Takeaway 02
China took the lead
China's electricity generation has grown over 600% since 2000 to roughly 10,000 TWh per year. In 2024, China generated more electricity than the US, EU, and India combined, with build-out rates still accelerating.
- Takeaway 03
One machine with no warehouse
Supply must match demand every second at exactly 60 Hz, or generators shut themselves down and failures cascade toward blackout. The grid is really four interconnections with only about 1.3 GW of East-West transfer capacity, and 61 of the 62 large transmission outage events from 2020 to 2024 were weather-related.
- Takeaway 04
Aging past its service life
The American Society of Civil Engineers grades US energy at a D+, with a $578B investment gap through 2026 alone. 70% of transformers and transmission lines are 25+ years old, and 60% of local distribution lines are 40+ years old.
- Takeaway 05
Demand is back and supply is stuck
The US needs roughly 2,000 TWh of new supply in the next 15 years after adding just 285 in the last 15, triple the forecast from two years ago. Meanwhile gas turbine orders placed today will not be met until 2028 to 2030 at the earliest, transformer costs are up 45 to 95% since 2019, and new transmission takes 10+ years to approve.
- Takeaway 06
The workarounds are the roadmap
The fastest levers are already visible: turning on idle backup generation worth tens of gigawatts, off-grid plants wired straight to data centers like xAI's Colossus build in Memphis, expected to exceed 1 GW, large-scale battery storage up over 20x from 2020 to 2025, and small modular reactors targeted to run at Idaho National Laboratory by July 2026.
Why This Matters
The deck is deliberately two-sided: the next five years are the greatest risk window for US energy, and the long term is a position of strength. For operators, the bottleneck map is the opportunity map. Whatever shortens the queue gets paid: turbines, transformers, off-grid generation for data centers, batteries, and the software that coordinates distributed supply. City-scale data center demand is likely inelastic; speed matters more than price. The watch items carry dates: gas turbine orders clear 2028 to 2030 at the earliest; wind and solar tax credits largely phase out by December 2027; the DOE targets small modular reactors running by July 2026; the IEA estimates data center demand near 1,000 TWh by 2030, the consumption of Russia or Japan today. Long term, the US is a net energy exporter with the fourth-largest proven gas reserves. The constraint is not resources but the machine connecting them to demand.
Featured Charts & Graphs
Chamath’s Take
Chamath’s audio commentary on this Brief is coming soon.